
Posted by randfish
Near the end of December 2011, we ran a survey on this blog asking consultants and agencies of all sizes and geographies to contribute their pricing models and cost structures. I'm pleased to share the results of that survey in the hopes that it will give everyone in the search industry a better idea of the range of fees and the services provided.
Obviously, this data is imperfect – SEOmoz is not a professional data surveying firm and our only tool was a basic list of questions on SurveyMonkey. That said, I'd be surprised if a professional surveyor found dramatically different data – there was enough participation to receive a trustworthy sample size and firms provided their personal/contact information (many of which I recognized while digging through the responses, but obviously will not be sharing identities publicly), which means we likely did not receive intentionally manipulative/misleading information. The data is provided below in three formats – first, some personal, high level takeaways from the survey, next an infographic from the great folks at AYTM Market Research and finally, a dump of the responses in CSV and Excel formats (without any personally identifiable info).

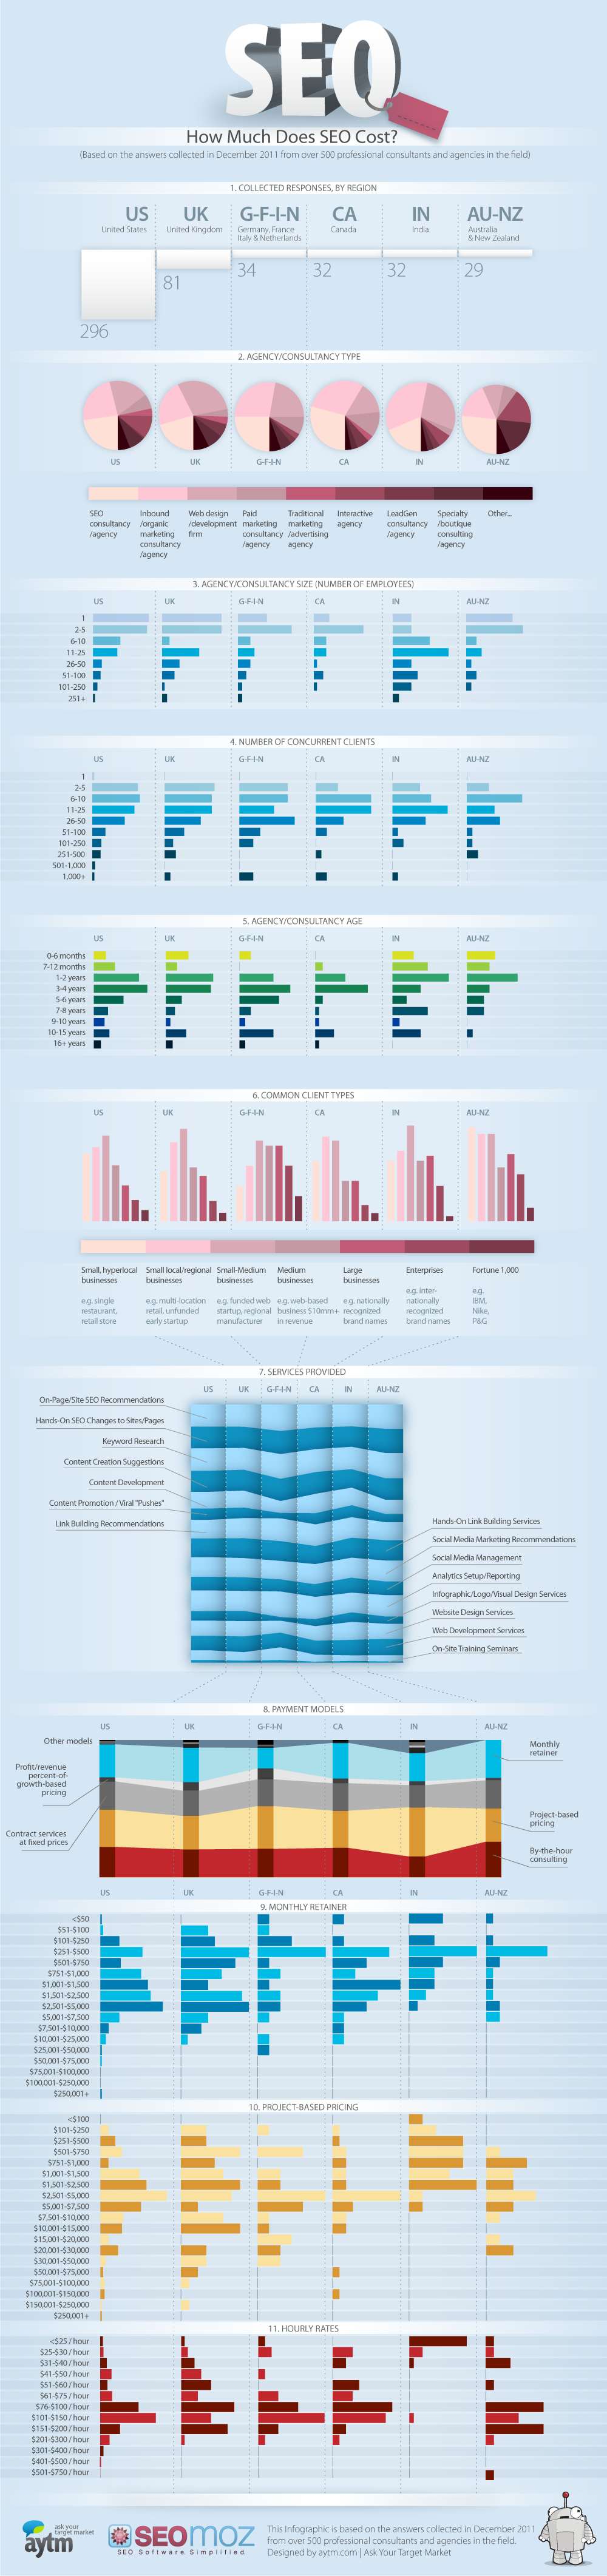
Do note that while 600+ responses were received, we've elected to share data only from those regions with 10+ responses (490 total), which include:
- United States – 287 respondents
- United Kingdom – 76 respondents
- Canada – 34 respondents
- Australia/New Zealand – 28 respondents
- Germany/France/Italy/Netherlands – 34 respondents
- India – 31 respondents
Many countries had 1-3 respondents and while we certainly appreciate those contributions, it's our feeling that sharing this data could actually be misleading/non-productive as a single firm/consultant could dramatically skew the results. All the information in this blog post, the infographic and the Excel data dump are split into those 6 regions.
Top 9 Takeaways
These are my personal takeaways from the data:
-
Hourly SEO Costs Vary Across Countries, but $76-$200/hour is Most Common
With the exception of India (the only developing region that was well-represented in our survey), hourly costs of $76-$200 (representing three responses) covered 50%+ of all firms. It was highest in Australia/New Zealand at 62%, followed by 58.1% in the US and 56% in Canada. Granted, this is a wide range, but it provides the answer to a frequently-asked question from those seeking SEO services for the first time.
_ -
By-the-Project Pricing is Popular and Most Commonly $1,000-$7,500
70.1% of respondents said they offer project-based pricing (the most common pricing system selected in the survey). 43% of consultancies were represented by the four price ranges: $1,001-$1,500, $1,501-$2,500, $2501-$5,000 and $5,001-$7,500. Obviously, there's a wide variety of prices here, not surprising given that the types of projects offered may be quite diverse.
_ -
Monthly Retainer Pricing Has the Widest Distribution
While both hourly and by-the-project rates do have a wide range of pricing, monthly retainers are certainly the most distributed of the price questions asked in our survey. The two most common were $251-$500/month (13.8%) and $2,501-$5,000/month (11.3%).
_ -
The Death of Hands-On SEO Has Been Greatly Exaggerated
There's been plenty of hand-wringing over the past few years from both bloggers and SEO clients complaining that consulting firms don't provide enough "hands-on" help. Yet, in the survey, 88.5% of respondents said they offer "hands-on SEO changes to sites" and 79.1% provide "hands-on link building." Clearly, hands-on help is still very popular.
_ -
Inbound/Organic > Pure SEO
Pure "SEO" consultants/agencies may be fading as broader "inbound marketing" services firms (offering SEO, social, content, conversion, analytics, etc) rise. The data showed 150 respondents (25%) saying they were primarily focused on SEO while a slightly greater number, 160 (26.7%), offered a broader range.
_ -
Web Design/Development Agencies do a Lot of SEO
The third most popular type of respondent was a web design/development agency offering SEO services. In the UK, these types of firms were better represented than either SEO-focused providers or broader inbound/organic firms.
_ -
Employees:Clients/Month Ratio is Between 1-2
The screenshot below takes advantage of SurveyMonkey's crosstab feature, which enabled me to look at the number of monthly active clients broken down by the quantity of employees a consulting firm has (you can only choose 5 responses at once, but the data's still revealing).

_ -
Vast Majority of Consultants Service Small-Medium Businesses
This may seem mathematically obvious, but it's not always top of mind at many of the marketing conferences I've attended, nor the blogosphere in general. A disproportionate amount of attention is often focused on top brands, but in the world of consulting, most firms service relatively small businesses. Even those who do serve larger businesses (perhaps aspirationally) often offer services to small and medium businesses. 41% of respondents offer consulting to small, hyperlocal businesses, e.g. the restaurant around the corner.
_ -
Though Project-Based Pricing is Most Popular, the Majority of Consultancies Also Offer Monthly Retainers and Hourly Rates
Early in my SEO career, project-based pricing seemed relatively rare (though quantifying this is hard since no formal surveys I'm aware of collected this info). Today, it was the top response, offered by 70% of the participating firms. Monthly retainer pricing was next, offered by 60%, followed closely by hourly rates (55%).
I'm certain others perusing the data will find other interesting takeaways (hope to read some of those in the comments).
Infographic from AYTM
Many thanks to the team at AYTM for putting together the following graphic representing the data in the survey across the 6 regions with more than 10 respondents. The image below shows a sample of their work and links to a larger version here on Moz:
Feel free to use/embed the larger, linked-to version, but please do provide credit back to AYTM and this post (nofollows are fine – just want to make sure folks are getting the right data source) 🙂
Data Dump Files
I've made two files available from the survey data for those interested in looking at the raw figures in more depth:
- Excel file with responses broken out by the 6 regions – download
- Unfiltered summary of responses to all questions – download
The individual results contain personally identifiable information, and even without the emails/company names, the details of location, services, pricing, etc. could be used to determine an individual consulting firm's identity. Given that we promised anonymity when launching the survey, I felt that providing this data, while valuable, wasn't appropriate. If you have specific filters you'd like to see applied, please let us know in the comments and we'll try to make that happen.
Many thanks to everyone who participated in this survey. In the next few months, SEOmoz will be launching a redux of our 2010 Industry Survey, which will hopefully provide even more detailed information across all parts of the search, social and inbound marketing fields. Stay tuned!


